Logging data with Strip Chart
The strip chart software can be used to continuously monitor various PVs (e.g., pressure, temperature, heater power, etc.).
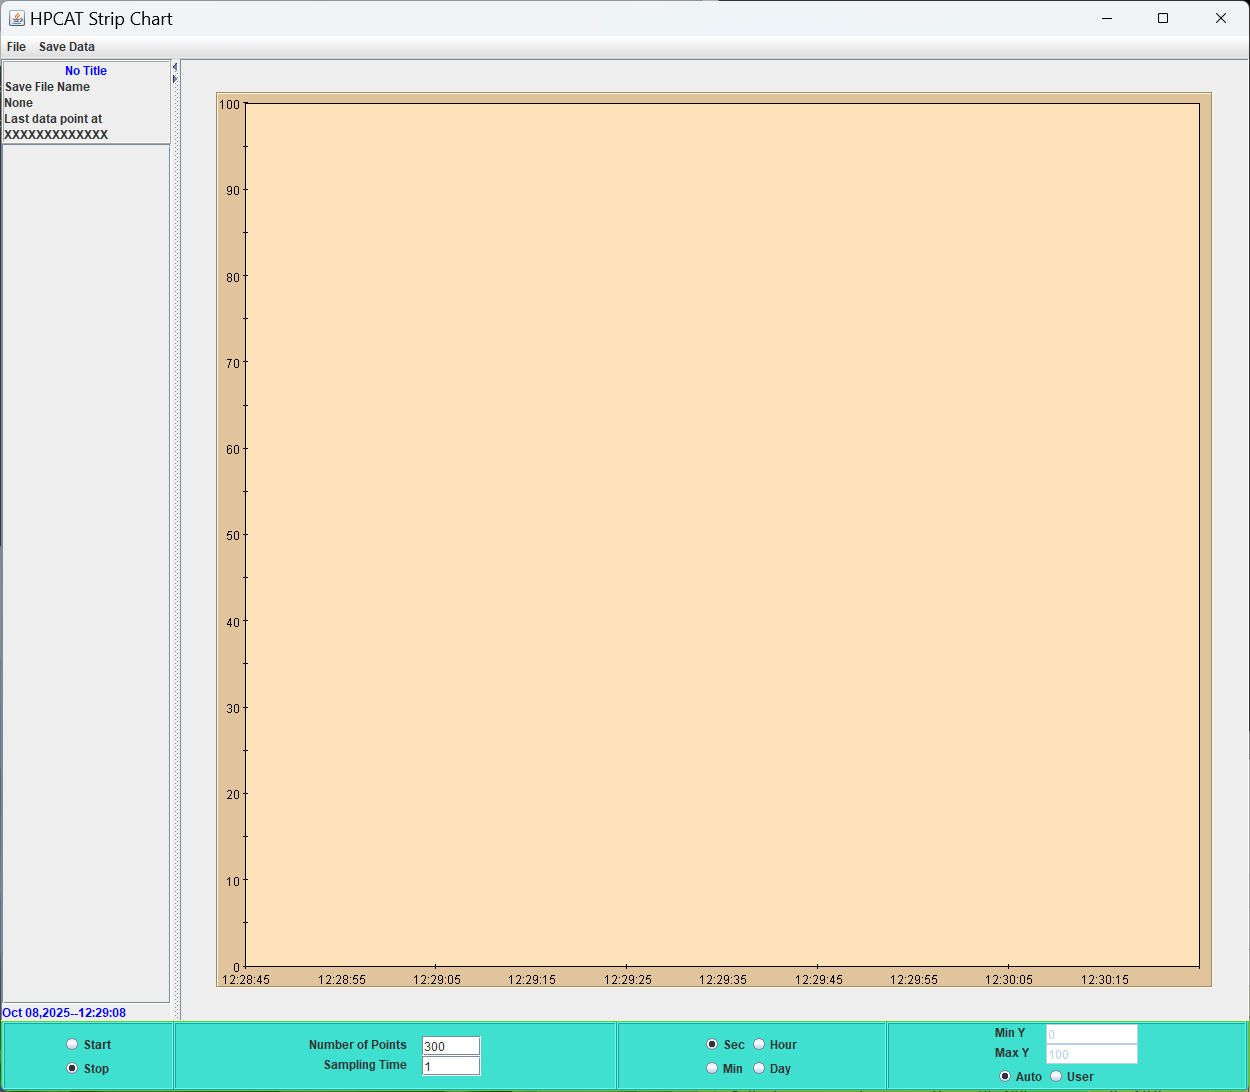
Open ‘Strip Chart’ from desktop shortcut.
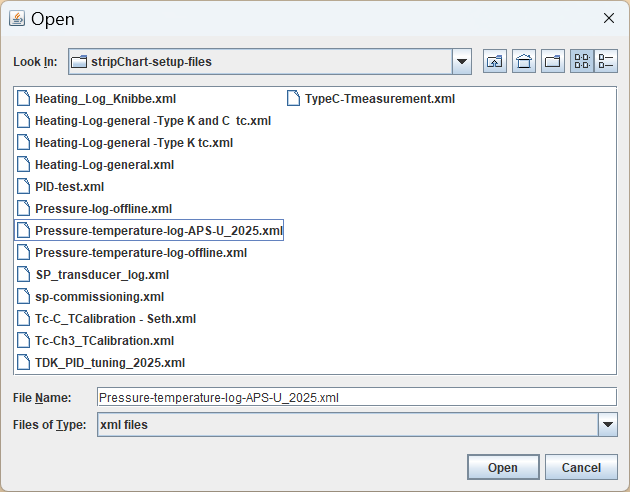
From the ‘File’ menu, select ‘Open’ and then select the folder ‘stipChart-setup-files.’ This will show a list of configuration files that tell the Strip Chart which PVs to monitor. The beamline staff can help you customize a file if needed. For basic pressure and temperature logging, select ‘Pressure-temperature-log.xml.’
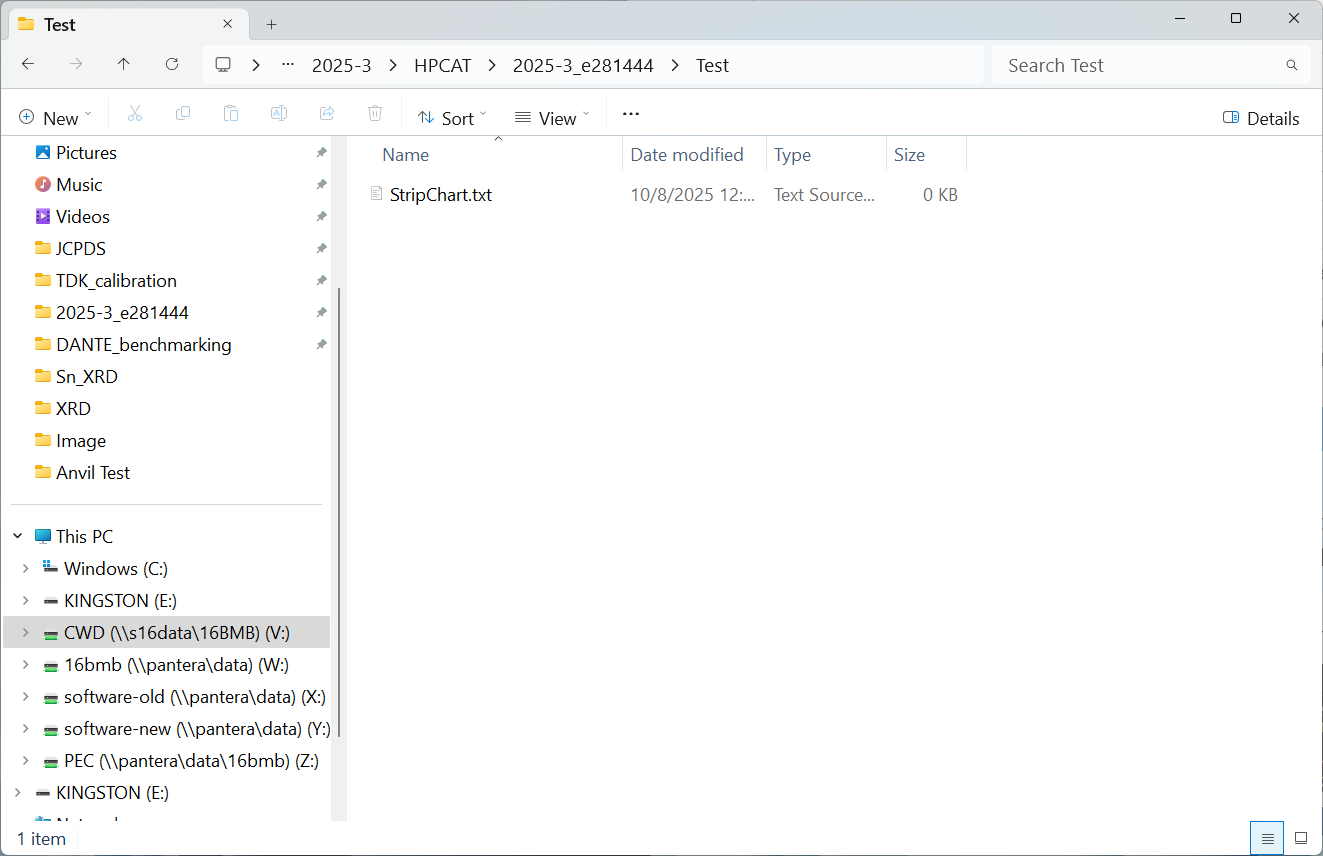
Next, navigate to the directory where you want to save your strip chart data and create a blank text file.
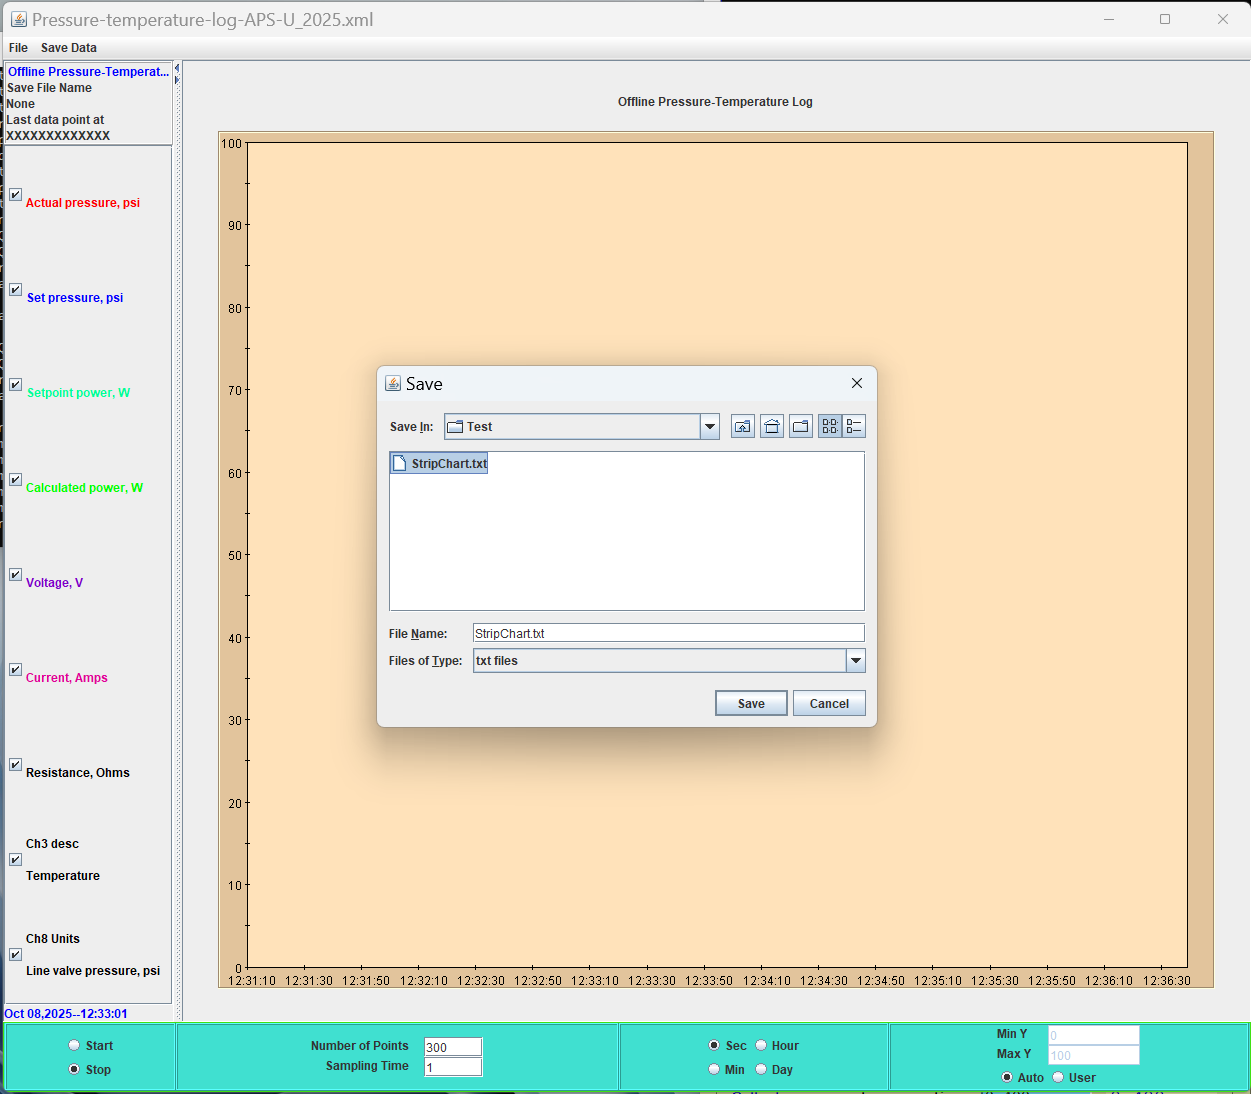
Navigate back to the Strip Chart interface. From the menu, select ‘Save Data -> Start’ and then navigate to the blank .txt file you just created. Select the file and click ‘Save.’ This will create an additional .txt file to which the strip chart software will write the monitored PVs.
Click ‘Start’ in the bottom lefthand corner of the strip chart interface. There should now be numerical values displayed for each PV and the strip chart should be plotting them continuously.
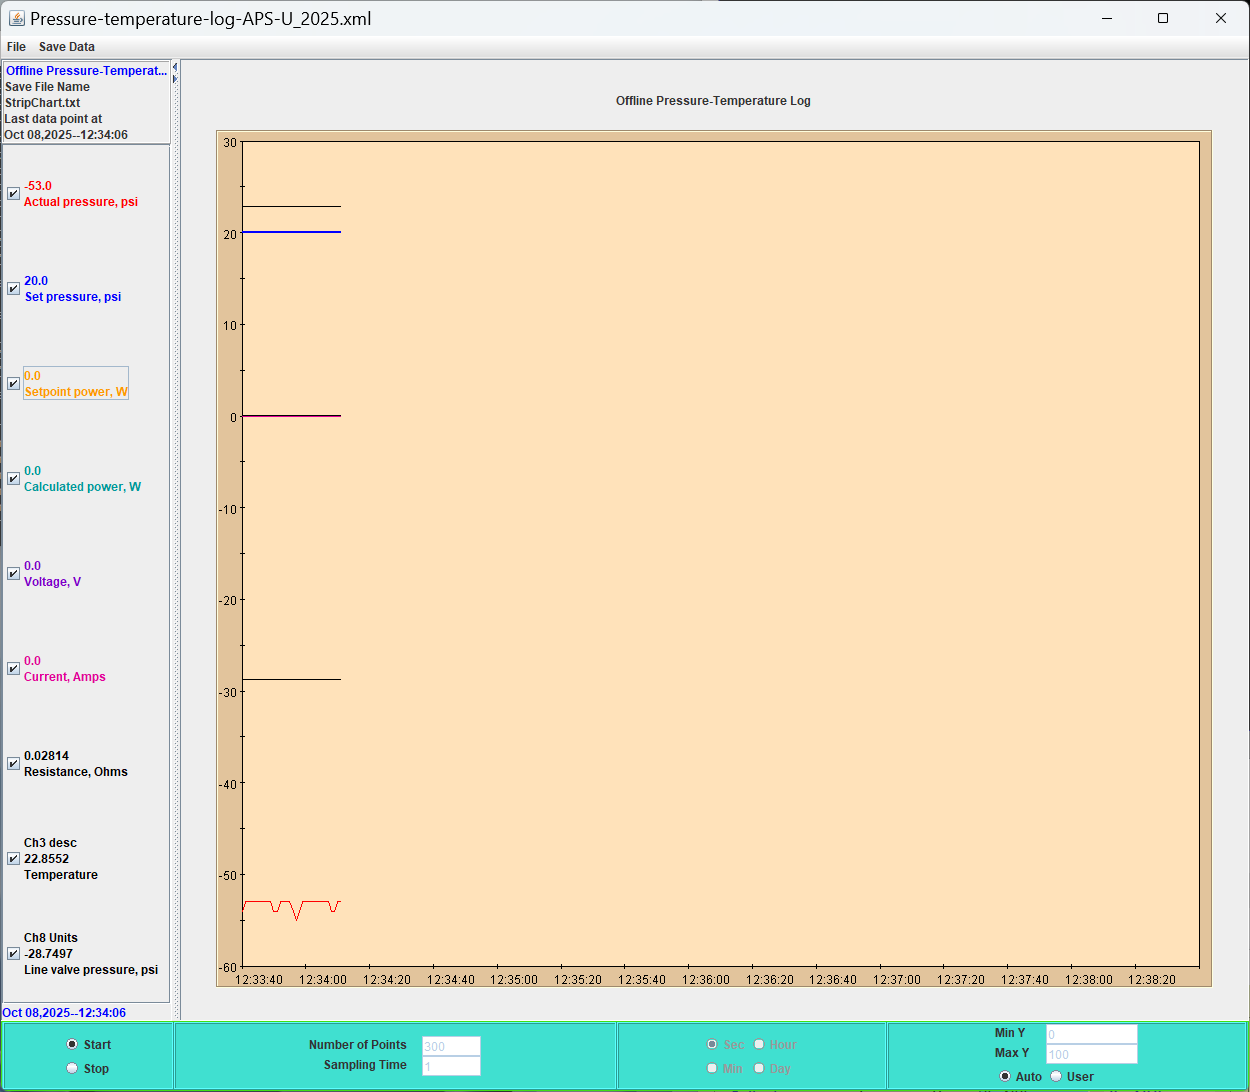
Click ‘Stop’ when you are finished logging data.